custom alt r crispr cas9 guide rnas Search Results


95
Integrated DNA Technologies alt-r crispr-cas9 negative control crrna
Alt R Crispr Cas9 Negative Control Crrna, supplied by Integrated DNA Technologies, used in various techniques. Bioz Stars score: 95/100, based on 1 PubMed citations. ZERO BIAS - scores, article reviews, protocol conditions and more
https://www.bioz.com/product/custom+alt+r+crispr+cas9+guide+rnas/Alt-R+CRISPR-Cas9+Negative+Control+crRNA/custom%401072544%4010%2E64898%2F2026%2E01%2E22%2E698702
Average 95 stars, based on 1 article reviews
alt-r crispr-cas9 negative control crrna - by Bioz Stars, 2026-10
95/100 stars
  Buy from Supplier

99
Integrated DNA Technologies alt r crispr cas9 tracrrna 5 nmol

Alt R Crispr Cas9 Tracrrna 5 Nmol, supplied by Integrated DNA Technologies, used in various techniques. Bioz Stars score: 99/100, based on 1 PubMed citations. ZERO BIAS - scores, article reviews, protocol conditions and more
https://www.bioz.com/product/custom+alt+r+crispr+cas9+guide+rnas/Cas9+Nuclease/pmc08819105-52-0-6
Average 99 stars, based on 1 article reviews
alt r crispr cas9 tracrrna 5 nmol - by Bioz Stars, 2026-10
99/100 stars
  Buy from Supplier

95
Danaher Inc alt r crispr cas9 system

Alt R Crispr Cas9 System, supplied by Danaher Inc, used in various techniques. Bioz Stars score: 95/100, based on 1 PubMed citations. ZERO BIAS - scores, article reviews, protocol conditions and more
https://www.bioz.com/product/custom+alt+r+crispr+cas9+guide+rnas/Alt-R+Cas9+Electroporation+Enhancer/pmc07439318-213-0-3
Average 95 stars, based on 1 article reviews
alt r crispr cas9 system - by Bioz Stars, 2026-10
95/100 stars
  Buy from Supplier

96
Danaher Inc hifi cas9 nuclease v3

Hifi Cas9 Nuclease V3, supplied by Danaher Inc, used in various techniques. Bioz Stars score: 96/100, based on 1 PubMed citations. ZERO BIAS - scores, article reviews, protocol conditions and more
https://www.bioz.com/product/custom+alt+r+crispr+cas9+guide+rnas/Alt-R+S%2Ep%2E+HiFi+Cas9+Nuclease+V3/pmc08804709-113-0-4
Average 96 stars, based on 1 article reviews
hifi cas9 nuclease v3 - by Bioz Stars, 2026-10
96/100 stars
  Buy from Supplier

95
Danaher Inc alt r crispr cas9 crrna targeting crebbp exon 26
A , Odds ratio (OR) analysis of <t>CREBBP</t> and KMT2D mutations among EZB/Cluster3 DLBCL (n=319) and FL_all (merged FL datasets, n=478) cohorts of patients. The p values were calculated by Fisher’s exact test. B , Representative H&E and B220 IHC images of formalin-fixed paraffin-embedded kidney and liver sections prepared from mice euthanized at day 116 post-BMT. The scale bars represent 380 pixels. C , Representative H&E, B220 and Ki67 IHC images of formalin-fixed paraffin-embedded spleen sections from mice euthanized at day 235 post-BMT. The scale bars represent 200 pixels. D , Representative FACS plots show the gating strategy and frequency of B220 + CD38 - FAS + splenic GC B cells in mice at day 235 post-BMT. E , FACS analysis showing the relative abundance of splenic total B cells (B220 + ) normalized to total single cells at day 116 and 235 post-BMT (mean ± SD). Each dot represents a mouse (n=4 mice per genotype).
Alt R Crispr Cas9 Crrna Targeting Crebbp Exon 26, supplied by Danaher Inc, used in various techniques. Bioz Stars score: 95/100, based on 1 PubMed citations. ZERO BIAS - scores, article reviews, protocol conditions and more
https://www.bioz.com/product/custom+alt+r+crispr+cas9+guide+rnas/CRISPR-Cas9+crRNA/bio_rxiv__2023__02__13__528351-321-11-8
Average 95 stars, based on 1 article reviews
alt r crispr cas9 crrna targeting crebbp exon 26 - by Bioz Stars, 2026-10
95/100 stars
  Buy from Supplier

98
Integrated DNA Technologies tracrrna
A , Odds ratio (OR) analysis of <t>CREBBP</t> and KMT2D mutations among EZB/Cluster3 DLBCL (n=319) and FL_all (merged FL datasets, n=478) cohorts of patients. The p values were calculated by Fisher’s exact test. B , Representative H&E and B220 IHC images of formalin-fixed paraffin-embedded kidney and liver sections prepared from mice euthanized at day 116 post-BMT. The scale bars represent 380 pixels. C , Representative H&E, B220 and Ki67 IHC images of formalin-fixed paraffin-embedded spleen sections from mice euthanized at day 235 post-BMT. The scale bars represent 200 pixels. D , Representative FACS plots show the gating strategy and frequency of B220 + CD38 - FAS + splenic GC B cells in mice at day 235 post-BMT. E , FACS analysis showing the relative abundance of splenic total B cells (B220 + ) normalized to total single cells at day 116 and 235 post-BMT (mean ± SD). Each dot represents a mouse (n=4 mice per genotype).
Tracrrna, supplied by Integrated DNA Technologies, used in various techniques. Bioz Stars score: 98/100, based on 1 PubMed citations. ZERO BIAS - scores, article reviews, protocol conditions and more
https://www.bioz.com/product/custom+alt+r+crispr+cas9+guide+rnas/tracrRNA/bio_rxiv__2022__06__13__495463-129-3-4
Average 98 stars, based on 1 article reviews
tracrrna - by Bioz Stars, 2026-10
98/100 stars
  Buy from Supplier

95
Integrated DNA Technologies custom alt r crispr cas9 guide rna
DNA-PKcs inhibition augments the efficiency of HDR-mediated gene editing Homozygous tagging of the centriolar distal appendage protein SCLT1 with the V5-epitope is presented as example. Characterization of the polyclonal population of RPE1 cells resulting from the electroporation with a SCLT1-V5-tagging RNP mixture <t>(Cas9,</t> SCLT1 gRNA and SCLT1-V5 Ultramer®) in the absence (DMSO) or presence (NU7441) of the DNA-PKcs inhibitor. (A) Centrioles are stained with anti-γTub antibody, V5 signal (if present) co-localizes with one of the two γTub-positive centrioles. White arrows indicate V5+ cells. Scale bar, 10 μm. Blow-ups without Hoechst 33342 are magnified 2.5×. (B) Bar chart showing the percentage of V5+ cells for each condition. N=3 independent experiments (with >100 cells visually scored for each condition), unpaired Student’s t test, ∗∗ = p < 0.05. (C) Electroporated RPE1, both untreated (DMSO) and treated with NU7441 were probed for V5 and compared to RPE1 parental cells. V5 signal, when present, corresponds to the expected molecular weight of 75 kDa.
Custom Alt R Crispr Cas9 Guide Rna, supplied by Integrated DNA Technologies, used in various techniques. Bioz Stars score: 95/100, based on 1 PubMed citations. ZERO BIAS - scores, article reviews, protocol conditions and more
https://www.bioz.com/product/custom+alt+r+crispr+cas9+guide+rnas/CRISPR-Cas9+gRNA/pmc08025146-30-1-0
Average 95 stars, based on 1 article reviews
custom alt r crispr cas9 guide rna - by Bioz Stars, 2026-10
95/100 stars
  Buy from Supplier

96
Integrated DNA Technologies cas9 nuclease v3
A) Schematic representation of the Coenzyme A and ergosterol biosynthesis pathways in fungi. B) AfPanK native promoter (PpanK) replacement strategy with <t>CRISPR-Cas9</t> system in A. fumigatus locus. Hygromycin resistance is conferred by the hph gene encoding a bacterial hygromycin B phosphotransferase while pNiiA is a nitrogen-regulated A. fumigatus promoter. pNiiA promoter is induced by nitrate or other secondary nitrogen source and repressed by ammonium or other primary nitrogen source. Primers for sequence validation are numbered P1-P3. PCR screen of hygromycin resistant transformants using two pair of primers P1/P2 and P3/P2 is provided in supplementary information. C) Radial growth capture of A. fumigatus wild-type and PniiA-panK strains in solid media under two different nitrogen sources. D) Expression of PanK in A. fumigatus wild-type and PniiA-panK strains under two different nitrogen sources. PanK expression was measured using rtPCR and normalized to basal actin expression. The data represent two biological replicates (n=2) and the plotted graphs represent the average ± SEM. E) Radial growth data of A. fumigatus wild-type and PniiA-panK strains in solid media under two different nitrogen sources. F) Solid medium assay captures of A. fumigatus wild-type and Pnii-ApanK strains in media with increasing concentrations of voriconazole. See also Table S2.
Cas9 Nuclease V3, supplied by Integrated DNA Technologies, used in various techniques. Bioz Stars score: 96/100, based on 1 PubMed citations. ZERO BIAS - scores, article reviews, protocol conditions and more
https://www.bioz.com/product/custom+alt+r+crispr+cas9+guide+rnas/Alt-R+S%2Ep%2E+Cas9+Nuclease+V3/pmc10042587-1078-8-16
Average 96 stars, based on 1 article reviews
cas9 nuclease v3 - by Bioz Stars, 2026-10
96/100 stars
  Buy from Supplier

95
Integrated DNA Technologies alt-r crispr-cas9 control kit, human
A) Schematic representation of the Coenzyme A and ergosterol biosynthesis pathways in fungi. B) AfPanK native promoter (PpanK) replacement strategy with <t>CRISPR-Cas9</t> system in A. fumigatus locus. Hygromycin resistance is conferred by the hph gene encoding a bacterial hygromycin B phosphotransferase while pNiiA is a nitrogen-regulated A. fumigatus promoter. pNiiA promoter is induced by nitrate or other secondary nitrogen source and repressed by ammonium or other primary nitrogen source. Primers for sequence validation are numbered P1-P3. PCR screen of hygromycin resistant transformants using two pair of primers P1/P2 and P3/P2 is provided in supplementary information. C) Radial growth capture of A. fumigatus wild-type and PniiA-panK strains in solid media under two different nitrogen sources. D) Expression of PanK in A. fumigatus wild-type and PniiA-panK strains under two different nitrogen sources. PanK expression was measured using rtPCR and normalized to basal actin expression. The data represent two biological replicates (n=2) and the plotted graphs represent the average ± SEM. E) Radial growth data of A. fumigatus wild-type and PniiA-panK strains in solid media under two different nitrogen sources. F) Solid medium assay captures of A. fumigatus wild-type and Pnii-ApanK strains in media with increasing concentrations of voriconazole. See also Table S2.
Alt R Crispr Cas9 Control Kit, Human, supplied by Integrated DNA Technologies, used in various techniques. Bioz Stars score: 95/100, based on 1 PubMed citations. ZERO BIAS - scores, article reviews, protocol conditions and more
https://www.bioz.com/product/custom+alt+r+crispr+cas9+guide+rnas/Alt-R+CRISPR-Cas9+Control+Kit%2C+Human/custom%401072554%4038702311
Average 95 stars, based on 1 article reviews
alt-r crispr-cas9 control kit, human - by Bioz Stars, 2026-10
95/100 stars
  Buy from Supplier

99
Integrated DNA Technologies high fidelity cas9 protein
a , Schematic representation of <t>CRISPR/Cas9-mediated</t> CISH KO using two guide RNAs (gRNA) targeting exon 4 of the CISH gene. b,c, CB-NK cells were expanded with K562 based feeder cells and IL-2, then either left non-transduced (NT) or transduced with a retroviral vector expressing iC9/CAR19/IL-15 construct on day 4 of expansion. On day 7 of expansion, NT and iC9/CAR19/IL-15-expressing CB-NK cells were nucleofected with Cas9 alone (Cas9 mock), Cas9 preloaded with gRNA targeting CISH exon 4 ( CISH KO) or non-nucleofected (WT). The CISH KO efficiency was determined by PCR ( b ) and western blot analysis ( c ). d , Sanger sequencing results showing multiple peaks reflecting non-homologous end joining (NHEJ) events in NT or iC9/CAR19/IL-15 (CAR) NK cells that underwent CISH KO compared to single peaks in CTRL (Cas9 mock). Arrows indicate the base pair position where the gene editing started. e , Bar graphs showing the relative mRNA expression levels of CISH determined on days 0, 7, 14 and 21 of expansion in NT (blue) and iC9/CAR19/IL-15 transduced (grey) NK cells by reverse transcription polymerase chain reaction (RT-PCR) (n=3). Note that on days 0 and 7 only data for NT-NK cells are included since the CAR transduction step is performed on day 4 of expansion.18 S ribosomal RNA (18S) was used as the internal reference gene. Bars represent mean values with standard deviation, *p ≤ 0.05.
High Fidelity Cas9 Protein, supplied by Integrated DNA Technologies, used in various techniques. Bioz Stars score: 99/100, based on 1 PubMed citations. ZERO BIAS - scores, article reviews, protocol conditions and more
https://www.bioz.com/product/custom+alt+r+crispr+cas9+guide+rnas/High-fidelity+Cas9+nuclease/bio_rxiv__2020__03__29__014472-102-4-12
Average 99 stars, based on 1 article reviews
high fidelity cas9 protein - by Bioz Stars, 2026-10
99/100 stars
  Buy from Supplier

96
Danaher Inc cas9 h840a nickase v3
a , Schematic representation of <t>CRISPR/Cas9-mediated</t> CISH KO using two guide RNAs (gRNA) targeting exon 4 of the CISH gene. b,c, CB-NK cells were expanded with K562 based feeder cells and IL-2, then either left non-transduced (NT) or transduced with a retroviral vector expressing iC9/CAR19/IL-15 construct on day 4 of expansion. On day 7 of expansion, NT and iC9/CAR19/IL-15-expressing CB-NK cells were nucleofected with Cas9 alone (Cas9 mock), Cas9 preloaded with gRNA targeting CISH exon 4 ( CISH KO) or non-nucleofected (WT). The CISH KO efficiency was determined by PCR ( b ) and western blot analysis ( c ). d , Sanger sequencing results showing multiple peaks reflecting non-homologous end joining (NHEJ) events in NT or iC9/CAR19/IL-15 (CAR) NK cells that underwent CISH KO compared to single peaks in CTRL (Cas9 mock). Arrows indicate the base pair position where the gene editing started. e , Bar graphs showing the relative mRNA expression levels of CISH determined on days 0, 7, 14 and 21 of expansion in NT (blue) and iC9/CAR19/IL-15 transduced (grey) NK cells by reverse transcription polymerase chain reaction (RT-PCR) (n=3). Note that on days 0 and 7 only data for NT-NK cells are included since the CAR transduction step is performed on day 4 of expansion.18 S ribosomal RNA (18S) was used as the internal reference gene. Bars represent mean values with standard deviation, *p ≤ 0.05.
Cas9 H840a Nickase V3, supplied by Danaher Inc, used in various techniques. Bioz Stars score: 96/100, based on 1 PubMed citations. ZERO BIAS - scores, article reviews, protocol conditions and more
https://www.bioz.com/product/custom+alt+r+crispr+cas9+guide+rnas/Alt-R+S%2Ep%2E+Cas9+H840A+Nickase+V3/pmc08489798-3-0-4
Average 96 stars, based on 1 article reviews
cas9 h840a nickase v3 - by Bioz Stars, 2026-10
96/100 stars
  Buy from Supplier

96
Integrated DNA Technologies cas9 r10a nickase
a , Schematic representation of <t>CRISPR/Cas9-mediated</t> CISH KO using two guide RNAs (gRNA) targeting exon 4 of the CISH gene. b,c, CB-NK cells were expanded with K562 based feeder cells and IL-2, then either left non-transduced (NT) or transduced with a retroviral vector expressing iC9/CAR19/IL-15 construct on day 4 of expansion. On day 7 of expansion, NT and iC9/CAR19/IL-15-expressing CB-NK cells were nucleofected with Cas9 alone (Cas9 mock), Cas9 preloaded with gRNA targeting CISH exon 4 ( CISH KO) or non-nucleofected (WT). The CISH KO efficiency was determined by PCR ( b ) and western blot analysis ( c ). d , Sanger sequencing results showing multiple peaks reflecting non-homologous end joining (NHEJ) events in NT or iC9/CAR19/IL-15 (CAR) NK cells that underwent CISH KO compared to single peaks in CTRL (Cas9 mock). Arrows indicate the base pair position where the gene editing started. e , Bar graphs showing the relative mRNA expression levels of CISH determined on days 0, 7, 14 and 21 of expansion in NT (blue) and iC9/CAR19/IL-15 transduced (grey) NK cells by reverse transcription polymerase chain reaction (RT-PCR) (n=3). Note that on days 0 and 7 only data for NT-NK cells are included since the CAR transduction step is performed on day 4 of expansion.18 S ribosomal RNA (18S) was used as the internal reference gene. Bars represent mean values with standard deviation, *p ≤ 0.05.
Cas9 R10a Nickase, supplied by Integrated DNA Technologies, used in various techniques. Bioz Stars score: 96/100, based on 1 PubMed citations. ZERO BIAS - scores, article reviews, protocol conditions and more
https://www.bioz.com/product/custom+alt+r+crispr+cas9+guide+rnas/Alt-R+S%2Ep%2E+Cas9+D10A+Nickase+V3/bio_rxiv__595868-103-17-22
Average 96 stars, based on 1 article reviews
cas9 r10a nickase - by Bioz Stars, 2026-10
96/100 stars
  Buy from Supplier

Image Search Results


Journal: iScience

Article Title: Establishment of a developmental toxicity assay based on human iPSC reporter to detect FGF signal disruption

doi: 10.1016/j.isci.2022.103770

Figure Lengend Snippet:

Article Snippet: Alt-R® CRISPR-Cas9 tracrRNA 5 nmol , Integrated DNA Technologies , Cat#1072532.

Techniques: Plasmid Preparation, Recombinant, CRISPR, Transfection, CCK-8 Assay, Luciferase, Software

A , Odds ratio (OR) analysis of CREBBP and KMT2D mutations among EZB/Cluster3 DLBCL (n=319) and FL_all (merged FL datasets, n=478) cohorts of patients. The p values were calculated by Fisher’s exact test. B , Representative H&E and B220 IHC images of formalin-fixed paraffin-embedded kidney and liver sections prepared from mice euthanized at day 116 post-BMT. The scale bars represent 380 pixels. C , Representative H&E, B220 and Ki67 IHC images of formalin-fixed paraffin-embedded spleen sections from mice euthanized at day 235 post-BMT. The scale bars represent 200 pixels. D , Representative FACS plots show the gating strategy and frequency of B220 + CD38 - FAS + splenic GC B cells in mice at day 235 post-BMT. E , FACS analysis showing the relative abundance of splenic total B cells (B220 + ) normalized to total single cells at day 116 and 235 post-BMT (mean ± SD). Each dot represents a mouse (n=4 mice per genotype).

Journal: bioRxiv

Article Title: Cooperative super-enhancer inactivation caused by heterozygous loss of CREBBP and KMT2D skews B cell fate decisions and yields T cell-depleted lymphomas

doi: 10.1101/2023.02.13.528351

Figure Lengend Snippet: A , Odds ratio (OR) analysis of CREBBP and KMT2D mutations among EZB/Cluster3 DLBCL (n=319) and FL_all (merged FL datasets, n=478) cohorts of patients. The p values were calculated by Fisher’s exact test. B , Representative H&E and B220 IHC images of formalin-fixed paraffin-embedded kidney and liver sections prepared from mice euthanized at day 116 post-BMT. The scale bars represent 380 pixels. C , Representative H&E, B220 and Ki67 IHC images of formalin-fixed paraffin-embedded spleen sections from mice euthanized at day 235 post-BMT. The scale bars represent 200 pixels. D , Representative FACS plots show the gating strategy and frequency of B220 + CD38 - FAS + splenic GC B cells in mice at day 235 post-BMT. E , FACS analysis showing the relative abundance of splenic total B cells (B220 + ) normalized to total single cells at day 116 and 235 post-BMT (mean ± SD). Each dot represents a mouse (n=4 mice per genotype).

Article Snippet: HiFi Cas9 Nuclease (IDT; 1081061), Alt-R CRISPR-Cas9 tracrRNA (IDT; 1072534), and Alt-R CRISPR-Cas9 crRNA targeting CREBBP exon 26 or KMT2D exon 4, were assembled in vitro following the manufacturer’s protocol and delivered into OCI-Ly7 cells by electroporation using SF Cell Line 96-well Nucleofector Kit (Lonza; V4SC-2096). ssODN for CREBBP R1446C mutagenesis was added along with RNP complex during electroporation as needed.

Techniques: Formalin-fixed Paraffin-Embedded
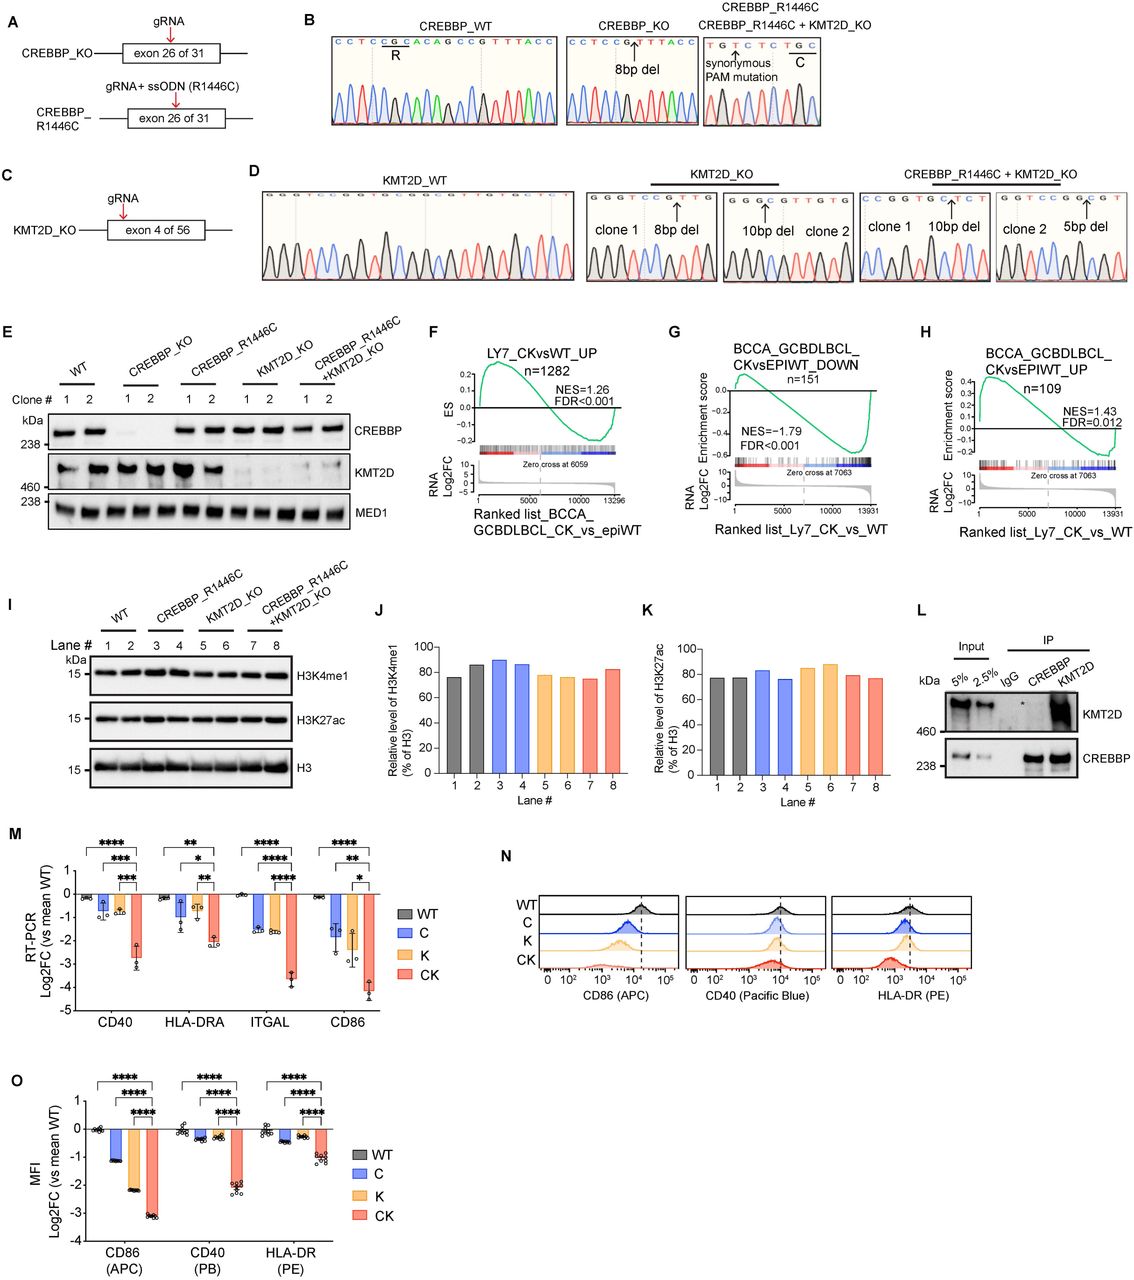
A , Experimental design for generating CREBBP -KO and CREBBP -R1446C, an enzymatically dead mutant, OCI-Ly7 cell lines. ssODN: single-stranded oligodeoxynucleotide. B , Sanger sequencing chromatogram confirming the homozygous knock out or R1446C point mutation in CREBBP . C , Experimental design for generating KMT2D -KO OCI-Ly7 cell line. D , Sanger sequencing chromatogram confirming the homozygous knock out of KMT2D . E , Immunoblotting for endogenous CREBBP and KMT2D in the indicated isogenic OCI-Ly7 cell lines using MED1 as internal loading control. F , GSEA plot using CK vs WT upregulated genes in OCI-Ly7 as the gene set against a ranked gene list based on CK vs epigenetic WT RNA-seq datasets of human BCCA cohort GCB-DLBCL patients. NES, normalized enrichment score. The p value was calculated by an empirical phenotype-based permutation test. The FDR is adjusted for gene set size and multiple hypotheses testing. G-H , GSEA plots using CK vs epigenetic WT ( G ) downregulated or ( H ) upregulated genes in human BCCA cohort GCB-DLBCL patients as the gene set against a ranked gene list based on CK vs WT OCI-Ly7 RNA-seq datasets. NES, normalized enrichment score. The p value was calculated by an empirical phenotype-based permutation test. The FDR is adjusted for gene set size and multiple hypotheses testing. I , Immunoblot for H3K4me1, H3K27ac and H3 in isogenic OCI-Ly7 cells. J-K , Relative densitometry of ( J ) H3K4me1 and ( K ) H3K27ac for panel I . L , Co-IP for assessing interaction between endogenous CREBBP and KMT2D in human SUDHL4 GCB-DLBCL cell line. M , RT-qPCR of indicated genes in different isogenic OCI-Ly7 cells. qPCR signal for each gene was normalized to those of HPRT and then mean WT and presented as log2 fold-change ± SEM. Statistical significance was determined using ordinary one-way ANOVA followed by Tukey-Kramer’s multiple comparisons test (**p < 0.01, ***p < 0.001, ****p < 0.0001). N , Stacked flow cytometry histograms showing the progressive signal decrease for the indicated surface markers in C, K, and CK-deficient OCI-Ly7 cells compared to WT. O , FACS measuring cell surface levels of the indicated markers in different isogenic OCI-Ly7 cells. Mean fluorescence intensity (MFI) of each surface marker was normalized to mean WT and presented as log2 fold-change ± SEM. Each dot represents a biological replicate. Statistical significance was determined using ordinary one-way ANOVA followed by Tukey-Kramer’s multiple comparisons test (****p < 0.0001).

Journal: bioRxiv

Article Title: Cooperative super-enhancer inactivation caused by heterozygous loss of CREBBP and KMT2D skews B cell fate decisions and yields T cell-depleted lymphomas

doi: 10.1101/2023.02.13.528351

Figure Lengend Snippet: A , Experimental design for generating CREBBP -KO and CREBBP -R1446C, an enzymatically dead mutant, OCI-Ly7 cell lines. ssODN: single-stranded oligodeoxynucleotide. B , Sanger sequencing chromatogram confirming the homozygous knock out or R1446C point mutation in CREBBP . C , Experimental design for generating KMT2D -KO OCI-Ly7 cell line. D , Sanger sequencing chromatogram confirming the homozygous knock out of KMT2D . E , Immunoblotting for endogenous CREBBP and KMT2D in the indicated isogenic OCI-Ly7 cell lines using MED1 as internal loading control. F , GSEA plot using CK vs WT upregulated genes in OCI-Ly7 as the gene set against a ranked gene list based on CK vs epigenetic WT RNA-seq datasets of human BCCA cohort GCB-DLBCL patients. NES, normalized enrichment score. The p value was calculated by an empirical phenotype-based permutation test. The FDR is adjusted for gene set size and multiple hypotheses testing. G-H , GSEA plots using CK vs epigenetic WT ( G ) downregulated or ( H ) upregulated genes in human BCCA cohort GCB-DLBCL patients as the gene set against a ranked gene list based on CK vs WT OCI-Ly7 RNA-seq datasets. NES, normalized enrichment score. The p value was calculated by an empirical phenotype-based permutation test. The FDR is adjusted for gene set size and multiple hypotheses testing. I , Immunoblot for H3K4me1, H3K27ac and H3 in isogenic OCI-Ly7 cells. J-K , Relative densitometry of ( J ) H3K4me1 and ( K ) H3K27ac for panel I . L , Co-IP for assessing interaction between endogenous CREBBP and KMT2D in human SUDHL4 GCB-DLBCL cell line. M , RT-qPCR of indicated genes in different isogenic OCI-Ly7 cells. qPCR signal for each gene was normalized to those of HPRT and then mean WT and presented as log2 fold-change ± SEM. Statistical significance was determined using ordinary one-way ANOVA followed by Tukey-Kramer’s multiple comparisons test (**p < 0.01, ***p < 0.001, ****p < 0.0001). N , Stacked flow cytometry histograms showing the progressive signal decrease for the indicated surface markers in C, K, and CK-deficient OCI-Ly7 cells compared to WT. O , FACS measuring cell surface levels of the indicated markers in different isogenic OCI-Ly7 cells. Mean fluorescence intensity (MFI) of each surface marker was normalized to mean WT and presented as log2 fold-change ± SEM. Each dot represents a biological replicate. Statistical significance was determined using ordinary one-way ANOVA followed by Tukey-Kramer’s multiple comparisons test (****p < 0.0001).

Article Snippet: HiFi Cas9 Nuclease (IDT; 1081061), Alt-R CRISPR-Cas9 tracrRNA (IDT; 1072534), and Alt-R CRISPR-Cas9 crRNA targeting CREBBP exon 26 or KMT2D exon 4, were assembled in vitro following the manufacturer’s protocol and delivered into OCI-Ly7 cells by electroporation using SF Cell Line 96-well Nucleofector Kit (Lonza; V4SC-2096). ssODN for CREBBP R1446C mutagenesis was added along with RNP complex during electroporation as needed.

Techniques: Mutagenesis, Sequencing, Knock-Out, Western Blot, Control, RNA Sequencing, Co-Immunoprecipitation Assay, Quantitative RT-PCR, Flow Cytometry, Fluorescence, Marker
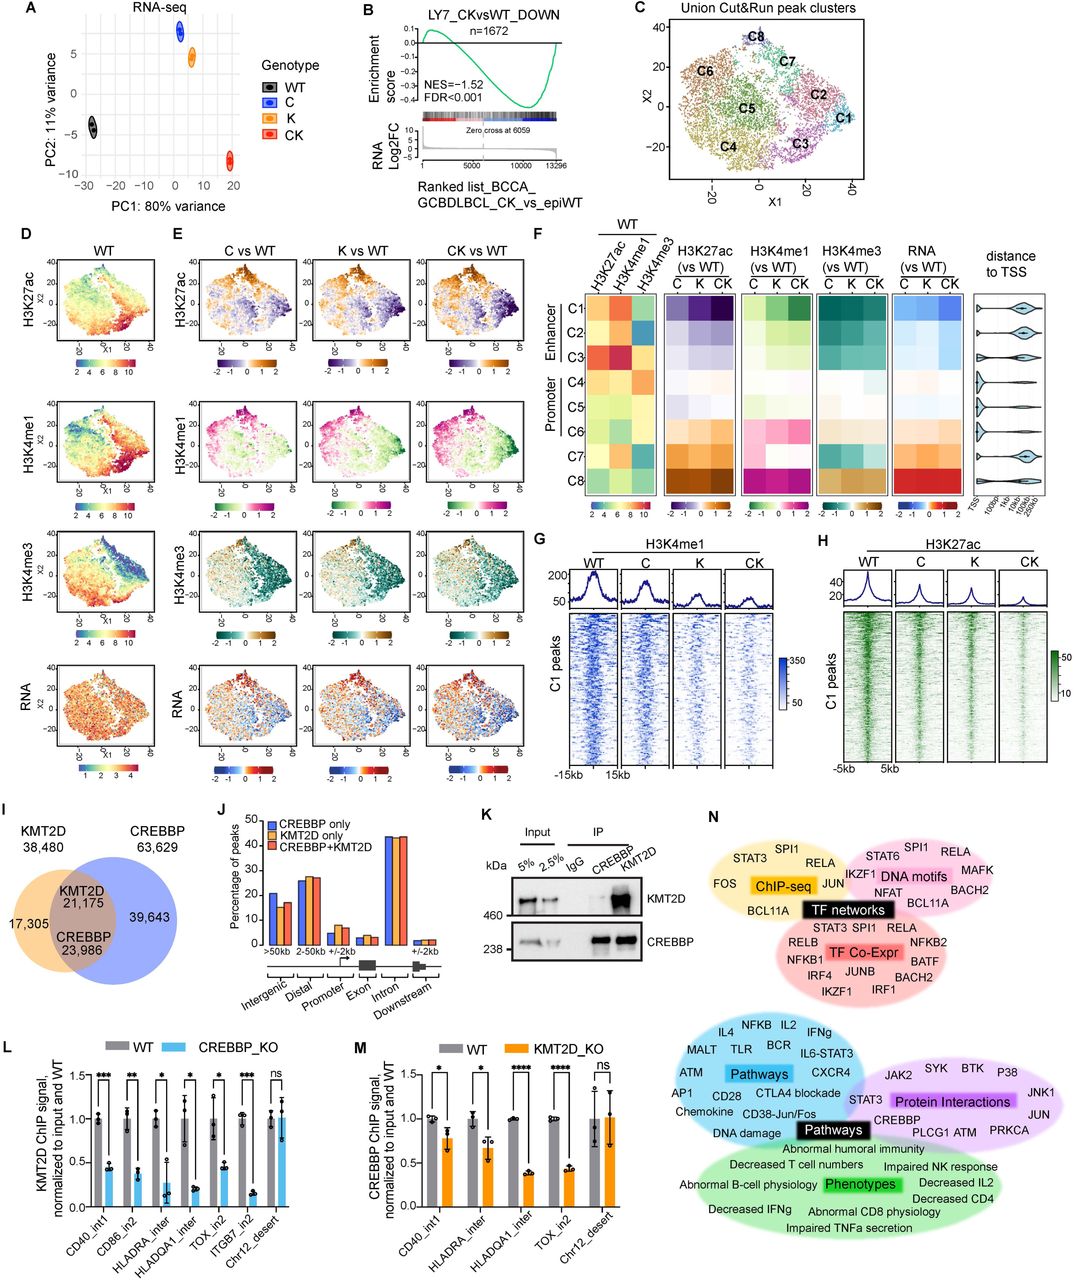
A , PCA analysis of RNA-seq datasets done in isogenic human OCI-Ly7 GCB-DLBCL cell lines (n=2 per genotype) using all genes normalized by VST. B , GSEA plot using CK vs WT downregulated genes in OCI-Ly7 as gene set against ranked gene list based on CK vs epigenetic WT (epiWT, no mutations in CREBBP , KMT2D , and EZH2 ) RNA-seq datasets of human BCCA cohort GCB-DLBCL patients. NES, normalized enrichment score. The p value was calculated by an empirical phenotype-based permutation test. The FDR is adjusted for gene set size and multiple hypotheses testing. C , t-SNE dimensionality reduction and K-means clustering of union peaks, generated by taking the union of H3K4me3, H3K4me1, and K3K27ac CUT&RUN signals from all isogenic OCI-Ly7 cell lines (WT, C, K, and CK), produced eight distinct clusters (named as C1-C8). D , t-SNE plots showing the basal level and distribution pattern of the indicated histone marks or RNA in WT OCI-Ly7 cells. The projected values are VST normalized counts. E , Read density changes for the indicated histone marks and RNA were projected onto t-SNE plots. The projected values are log2FC signal between the indicated genotypes. F , Heatmaps showing median VST normalized read density (left) or read density change (median log2FC) in C/K/CK relative to WT (middle and right) of the indicated histone marks or RNA-seq for each cluster defined in panel C . Distance to TSS plot shows the distance of union peaks to their closest TSSs. G-H , Average signal profiles (top) and heatmaps (bottom) displaying ( G ) H3K4me1 and ( H ) H3K27ac CUT&RUN signals around peak summit (+/-15kb) or peak center (+/-5kb), respectively at C1 peak regions. I , Venn diagram displaying overlap between CREBBP and KMT2D ChIP-seq peaks in OCI-Ly7. J , Genomic feature annotation of CREBBP-unique, KMT2D-unique, and CREBBP/KMT2D-co-bound ChIP-seq peaks. The definitions for different genomic features are depicted below the bar plot. K , Co-IP for assessing interaction between endogenous CREBBP and KMT2D in OCI-Ly7. CREBBP, KMT2D and IgG control were immunoprecipitated from OCI-Ly7 nuclear extracts. Western blots were performed using anti-CREBBP and KMT2D antibodies. L-M , ChIP-qPCR quantifying binding of endogenous ( L ) KMT2D and ( M ) CREBBP at the indicated gene loci in the indicated isogenic OCI-Ly7 cell lines. ChIP signals from three independent experiments were normalized to input and then to WT and presented as mean ± SD. The p values were calculated by unpaired t test and BH adjusted for multiple comparisons and denoted as follows: ns p > 0.05; *p < 0.05; **p < 0.01; ***p < 0.001; ****p < 0.0001. N , Functional annotation of C1 genes (n=401) by Enrichr and Toppgene ( , ).

Journal: bioRxiv

Article Title: Cooperative super-enhancer inactivation caused by heterozygous loss of CREBBP and KMT2D skews B cell fate decisions and yields T cell-depleted lymphomas

doi: 10.1101/2023.02.13.528351

Figure Lengend Snippet: A , PCA analysis of RNA-seq datasets done in isogenic human OCI-Ly7 GCB-DLBCL cell lines (n=2 per genotype) using all genes normalized by VST. B , GSEA plot using CK vs WT downregulated genes in OCI-Ly7 as gene set against ranked gene list based on CK vs epigenetic WT (epiWT, no mutations in CREBBP , KMT2D , and EZH2 ) RNA-seq datasets of human BCCA cohort GCB-DLBCL patients. NES, normalized enrichment score. The p value was calculated by an empirical phenotype-based permutation test. The FDR is adjusted for gene set size and multiple hypotheses testing. C , t-SNE dimensionality reduction and K-means clustering of union peaks, generated by taking the union of H3K4me3, H3K4me1, and K3K27ac CUT&RUN signals from all isogenic OCI-Ly7 cell lines (WT, C, K, and CK), produced eight distinct clusters (named as C1-C8). D , t-SNE plots showing the basal level and distribution pattern of the indicated histone marks or RNA in WT OCI-Ly7 cells. The projected values are VST normalized counts. E , Read density changes for the indicated histone marks and RNA were projected onto t-SNE plots. The projected values are log2FC signal between the indicated genotypes. F , Heatmaps showing median VST normalized read density (left) or read density change (median log2FC) in C/K/CK relative to WT (middle and right) of the indicated histone marks or RNA-seq for each cluster defined in panel C . Distance to TSS plot shows the distance of union peaks to their closest TSSs. G-H , Average signal profiles (top) and heatmaps (bottom) displaying ( G ) H3K4me1 and ( H ) H3K27ac CUT&RUN signals around peak summit (+/-15kb) or peak center (+/-5kb), respectively at C1 peak regions. I , Venn diagram displaying overlap between CREBBP and KMT2D ChIP-seq peaks in OCI-Ly7. J , Genomic feature annotation of CREBBP-unique, KMT2D-unique, and CREBBP/KMT2D-co-bound ChIP-seq peaks. The definitions for different genomic features are depicted below the bar plot. K , Co-IP for assessing interaction between endogenous CREBBP and KMT2D in OCI-Ly7. CREBBP, KMT2D and IgG control were immunoprecipitated from OCI-Ly7 nuclear extracts. Western blots were performed using anti-CREBBP and KMT2D antibodies. L-M , ChIP-qPCR quantifying binding of endogenous ( L ) KMT2D and ( M ) CREBBP at the indicated gene loci in the indicated isogenic OCI-Ly7 cell lines. ChIP signals from three independent experiments were normalized to input and then to WT and presented as mean ± SD. The p values were calculated by unpaired t test and BH adjusted for multiple comparisons and denoted as follows: ns p > 0.05; *p < 0.05; **p < 0.01; ***p < 0.001; ****p < 0.0001. N , Functional annotation of C1 genes (n=401) by Enrichr and Toppgene ( , ).

Article Snippet: HiFi Cas9 Nuclease (IDT; 1081061), Alt-R CRISPR-Cas9 tracrRNA (IDT; 1072534), and Alt-R CRISPR-Cas9 crRNA targeting CREBBP exon 26 or KMT2D exon 4, were assembled in vitro following the manufacturer’s protocol and delivered into OCI-Ly7 cells by electroporation using SF Cell Line 96-well Nucleofector Kit (Lonza; V4SC-2096). ssODN for CREBBP R1446C mutagenesis was added along with RNP complex during electroporation as needed.

Techniques: RNA Sequencing, Generated, Produced, ChIP-sequencing, Co-Immunoprecipitation Assay, Control, Immunoprecipitation, Western Blot, ChIP-qPCR, Binding Assay, Functional Assay

DNA-PKcs inhibition augments the efficiency of HDR-mediated gene editing Homozygous tagging of the centriolar distal appendage protein SCLT1 with the V5-epitope is presented as example. Characterization of the polyclonal population of RPE1 cells resulting from the electroporation with a SCLT1-V5-tagging RNP mixture (Cas9, SCLT1 gRNA and SCLT1-V5 Ultramer®) in the absence (DMSO) or presence (NU7441) of the DNA-PKcs inhibitor. (A) Centrioles are stained with anti-γTub antibody, V5 signal (if present) co-localizes with one of the two γTub-positive centrioles. White arrows indicate V5+ cells. Scale bar, 10 μm. Blow-ups without Hoechst 33342 are magnified 2.5×. (B) Bar chart showing the percentage of V5+ cells for each condition. N=3 independent experiments (with >100 cells visually scored for each condition), unpaired Student’s t test, ∗∗ = p < 0.05. (C) Electroporated RPE1, both untreated (DMSO) and treated with NU7441 were probed for V5 and compared to RPE1 parental cells. V5 signal, when present, corresponds to the expected molecular weight of 75 kDa.

Journal: STAR Protocols

Article Title: CRISPR/Cas9 ribonucleoprotein-mediated knockin generation in hTERT-RPE1 cells

doi: 10.1016/j.xpro.2021.100407

Figure Lengend Snippet: DNA-PKcs inhibition augments the efficiency of HDR-mediated gene editing Homozygous tagging of the centriolar distal appendage protein SCLT1 with the V5-epitope is presented as example. Characterization of the polyclonal population of RPE1 cells resulting from the electroporation with a SCLT1-V5-tagging RNP mixture (Cas9, SCLT1 gRNA and SCLT1-V5 Ultramer®) in the absence (DMSO) or presence (NU7441) of the DNA-PKcs inhibitor. (A) Centrioles are stained with anti-γTub antibody, V5 signal (if present) co-localizes with one of the two γTub-positive centrioles. White arrows indicate V5+ cells. Scale bar, 10 μm. Blow-ups without Hoechst 33342 are magnified 2.5×. (B) Bar chart showing the percentage of V5+ cells for each condition. N=3 independent experiments (with >100 cells visually scored for each condition), unpaired Student’s t test, ∗∗ = p < 0.05. (C) Electroporated RPE1, both untreated (DMSO) and treated with NU7441 were probed for V5 and compared to RPE1 parental cells. V5 signal, when present, corresponds to the expected molecular weight of 75 kDa.

Article Snippet: IDT™ Custom Alt-R® CRISPR-Cas9 guide RNA , N/A , https://eu.idtdna.com/site/order/designtool/index/CRISPR_CUSTOM.

Techniques: Inhibition, Electroporation, Staining, Molecular Weight

Journal: STAR Protocols

Article Title: CRISPR/Cas9 ribonucleoprotein-mediated knockin generation in hTERT-RPE1 cells

doi: 10.1016/j.xpro.2021.100407

Figure Lengend Snippet:

Article Snippet: IDT™ Custom Alt-R® CRISPR-Cas9 guide RNA , N/A , https://eu.idtdna.com/site/order/designtool/index/CRISPR_CUSTOM.

Techniques: Recombinant, Purification, Plasmid Preparation, CRISPR, Electroporation, Software

A) Schematic representation of the Coenzyme A and ergosterol biosynthesis pathways in fungi. B) AfPanK native promoter (PpanK) replacement strategy with CRISPR-Cas9 system in A. fumigatus locus. Hygromycin resistance is conferred by the hph gene encoding a bacterial hygromycin B phosphotransferase while pNiiA is a nitrogen-regulated A. fumigatus promoter. pNiiA promoter is induced by nitrate or other secondary nitrogen source and repressed by ammonium or other primary nitrogen source. Primers for sequence validation are numbered P1-P3. PCR screen of hygromycin resistant transformants using two pair of primers P1/P2 and P3/P2 is provided in supplementary information. C) Radial growth capture of A. fumigatus wild-type and PniiA-panK strains in solid media under two different nitrogen sources. D) Expression of PanK in A. fumigatus wild-type and PniiA-panK strains under two different nitrogen sources. PanK expression was measured using rtPCR and normalized to basal actin expression. The data represent two biological replicates (n=2) and the plotted graphs represent the average ± SEM. E) Radial growth data of A. fumigatus wild-type and PniiA-panK strains in solid media under two different nitrogen sources. F) Solid medium assay captures of A. fumigatus wild-type and Pnii-ApanK strains in media with increasing concentrations of voriconazole. See also Table S2.

Journal: Structure (London, England : 1993)

Article Title: High Resolution Crystal Structure and Chemical Screening Reveal Pantothenate Kinase as a New Target for Antifungal Development

doi: 10.1016/j.str.2022.09.001

Figure Lengend Snippet: A) Schematic representation of the Coenzyme A and ergosterol biosynthesis pathways in fungi. B) AfPanK native promoter (PpanK) replacement strategy with CRISPR-Cas9 system in A. fumigatus locus. Hygromycin resistance is conferred by the hph gene encoding a bacterial hygromycin B phosphotransferase while pNiiA is a nitrogen-regulated A. fumigatus promoter. pNiiA promoter is induced by nitrate or other secondary nitrogen source and repressed by ammonium or other primary nitrogen source. Primers for sequence validation are numbered P1-P3. PCR screen of hygromycin resistant transformants using two pair of primers P1/P2 and P3/P2 is provided in supplementary information. C) Radial growth capture of A. fumigatus wild-type and PniiA-panK strains in solid media under two different nitrogen sources. D) Expression of PanK in A. fumigatus wild-type and PniiA-panK strains under two different nitrogen sources. PanK expression was measured using rtPCR and normalized to basal actin expression. The data represent two biological replicates (n=2) and the plotted graphs represent the average ± SEM. E) Radial growth data of A. fumigatus wild-type and PniiA-panK strains in solid media under two different nitrogen sources. F) Solid medium assay captures of A. fumigatus wild-type and Pnii-ApanK strains in media with increasing concentrations of voriconazole. See also Table S2.

Article Snippet: All CRISPR reagents, including the crRNAs, tracrRNA, and Cas9 nuclease V3 and associated buffers were from Integrated DNA Technologies (IDT).

Techniques: CRISPR, Sequencing, Expressing, Reverse Transcription Polymerase Chain Reaction

a , Schematic representation of CRISPR/Cas9-mediated CISH KO using two guide RNAs (gRNA) targeting exon 4 of the CISH gene. b,c, CB-NK cells were expanded with K562 based feeder cells and IL-2, then either left non-transduced (NT) or transduced with a retroviral vector expressing iC9/CAR19/IL-15 construct on day 4 of expansion. On day 7 of expansion, NT and iC9/CAR19/IL-15-expressing CB-NK cells were nucleofected with Cas9 alone (Cas9 mock), Cas9 preloaded with gRNA targeting CISH exon 4 ( CISH KO) or non-nucleofected (WT). The CISH KO efficiency was determined by PCR ( b ) and western blot analysis ( c ). d , Sanger sequencing results showing multiple peaks reflecting non-homologous end joining (NHEJ) events in NT or iC9/CAR19/IL-15 (CAR) NK cells that underwent CISH KO compared to single peaks in CTRL (Cas9 mock). Arrows indicate the base pair position where the gene editing started. e , Bar graphs showing the relative mRNA expression levels of CISH determined on days 0, 7, 14 and 21 of expansion in NT (blue) and iC9/CAR19/IL-15 transduced (grey) NK cells by reverse transcription polymerase chain reaction (RT-PCR) (n=3). Note that on days 0 and 7 only data for NT-NK cells are included since the CAR transduction step is performed on day 4 of expansion.18 S ribosomal RNA (18S) was used as the internal reference gene. Bars represent mean values with standard deviation, *p ≤ 0.05.

Journal: bioRxiv

Article Title: CIS checkpoint deletion enhances the fitness of cord blood derived natural killer cells transduced with a chimeric antigen receptor

doi: 10.1101/2020.03.29.014472

Figure Lengend Snippet: a , Schematic representation of CRISPR/Cas9-mediated CISH KO using two guide RNAs (gRNA) targeting exon 4 of the CISH gene. b,c, CB-NK cells were expanded with K562 based feeder cells and IL-2, then either left non-transduced (NT) or transduced with a retroviral vector expressing iC9/CAR19/IL-15 construct on day 4 of expansion. On day 7 of expansion, NT and iC9/CAR19/IL-15-expressing CB-NK cells were nucleofected with Cas9 alone (Cas9 mock), Cas9 preloaded with gRNA targeting CISH exon 4 ( CISH KO) or non-nucleofected (WT). The CISH KO efficiency was determined by PCR ( b ) and western blot analysis ( c ). d , Sanger sequencing results showing multiple peaks reflecting non-homologous end joining (NHEJ) events in NT or iC9/CAR19/IL-15 (CAR) NK cells that underwent CISH KO compared to single peaks in CTRL (Cas9 mock). Arrows indicate the base pair position where the gene editing started. e , Bar graphs showing the relative mRNA expression levels of CISH determined on days 0, 7, 14 and 21 of expansion in NT (blue) and iC9/CAR19/IL-15 transduced (grey) NK cells by reverse transcription polymerase chain reaction (RT-PCR) (n=3). Note that on days 0 and 7 only data for NT-NK cells are included since the CAR transduction step is performed on day 4 of expansion.18 S ribosomal RNA (18S) was used as the internal reference gene. Bars represent mean values with standard deviation, *p ≤ 0.05.

Article Snippet: The use of a high fidelity Cas9 protein (Alt-R HiFi Cas9 v3, IDT) further reduced the risk of off-target events to <0.5% ( ).

Techniques: CRISPR, Transduction, Plasmid Preparation, Expressing, Construct, Western Blot, Sequencing, Non-Homologous End Joining, Reverse Transcription Polymerase Chain Reaction, Standard Deviation

a , Comparative heatmap of mass cytometry data showing the expression of NK cell surface markers, transcription factors and cytotoxicity markers in iC9/CAR19/IL-15 CISH KO compared to iC9/CAR19/IL-15 CTRL NK cells. Each column represents a separate cluster identified by FlowSOM analysis and each row reflects the expression of a certain marker for each annotation. Color scale shows the expression level for each marker, with red representing higher expression and blue lower expression in iC9/CAR19/IL-15 CISH KO NK cells. The t-SNE map generated from FlowSOM analysis in the right panel shows the 20 NK cell meclusters (MC) represented in the mass cytometry heat map in the left panel. b , Individual t-SNE maps show the expression of selected NK cell markers for iC9/CAR19/IL-15 CISH KO compared to iC9/CAR19/IL-15 CTRL NK cells. Color scale indicates signal intensity, ranging from low (blue) to high (red) after arcsine transformation. c , Global gene expression analysis by RNA sequencing. Heat map displays the genes that were differentially expressed in purified iC9/CAR19/IL-15 CISH KO vs. iC9/CAR19/IL15 CTRL NK cells (n=4). Color scale shows the expression level of each marker, with red representing higher expression and blue lower expression in iC9/CAR19/IL-15 CTRL (CAR) or iC9/CAR19/IL-15 CISH KO (CAR KO) NK cells (q< 0.1 and absolute log2foldchange > 0.8). d, Gene set enrichment analysis (GSEA) showing enrichment analysis (GSEA) showing enrichment in IFN-γ response, TNF-α signaling via NF-kB, IL-2/STAT5 signaling, IL-6/JAK/STAT3 signaling and inflammatory response in iC9/CAR19/IL-15 CISH KO compared to iC9/CAR19/IL-15 CTRL NK cells. e , Representative histogram showing enhanced phosphorylation of STAT5 (p-STAT5), STAT3 (p-STAT3) and phospholipase C gamma 1 (p-PLCγ1) in iC9/CAR19/IL-15 CISH KO vs. iC9/CAR19/IL-15 CTRL NK cells after co-culture with Raji cells for 30 minutes. Blue histograms represent CAR Cas9 CTRL and red histograms represent CAR CISH KO. f , Bar graphs showing mean fluorescence intensity (MFI) of p-STAT5, p-STAT3 and p-PLCγ1 in iC9/CAR19/IL-15 CISH KO vs. iC9/CAR19/IL-15 CTRL NK cells (n=3). Bars represent mean values with standard deviation, **p ≤ 0.01.

Journal: bioRxiv

Article Title: CIS checkpoint deletion enhances the fitness of cord blood derived natural killer cells transduced with a chimeric antigen receptor

doi: 10.1101/2020.03.29.014472

Figure Lengend Snippet: a , Comparative heatmap of mass cytometry data showing the expression of NK cell surface markers, transcription factors and cytotoxicity markers in iC9/CAR19/IL-15 CISH KO compared to iC9/CAR19/IL-15 CTRL NK cells. Each column represents a separate cluster identified by FlowSOM analysis and each row reflects the expression of a certain marker for each annotation. Color scale shows the expression level for each marker, with red representing higher expression and blue lower expression in iC9/CAR19/IL-15 CISH KO NK cells. The t-SNE map generated from FlowSOM analysis in the right panel shows the 20 NK cell meclusters (MC) represented in the mass cytometry heat map in the left panel. b , Individual t-SNE maps show the expression of selected NK cell markers for iC9/CAR19/IL-15 CISH KO compared to iC9/CAR19/IL-15 CTRL NK cells. Color scale indicates signal intensity, ranging from low (blue) to high (red) after arcsine transformation. c , Global gene expression analysis by RNA sequencing. Heat map displays the genes that were differentially expressed in purified iC9/CAR19/IL-15 CISH KO vs. iC9/CAR19/IL15 CTRL NK cells (n=4). Color scale shows the expression level of each marker, with red representing higher expression and blue lower expression in iC9/CAR19/IL-15 CTRL (CAR) or iC9/CAR19/IL-15 CISH KO (CAR KO) NK cells (q< 0.1 and absolute log2foldchange > 0.8). d, Gene set enrichment analysis (GSEA) showing enrichment analysis (GSEA) showing enrichment in IFN-γ response, TNF-α signaling via NF-kB, IL-2/STAT5 signaling, IL-6/JAK/STAT3 signaling and inflammatory response in iC9/CAR19/IL-15 CISH KO compared to iC9/CAR19/IL-15 CTRL NK cells. e , Representative histogram showing enhanced phosphorylation of STAT5 (p-STAT5), STAT3 (p-STAT3) and phospholipase C gamma 1 (p-PLCγ1) in iC9/CAR19/IL-15 CISH KO vs. iC9/CAR19/IL-15 CTRL NK cells after co-culture with Raji cells for 30 minutes. Blue histograms represent CAR Cas9 CTRL and red histograms represent CAR CISH KO. f , Bar graphs showing mean fluorescence intensity (MFI) of p-STAT5, p-STAT3 and p-PLCγ1 in iC9/CAR19/IL-15 CISH KO vs. iC9/CAR19/IL-15 CTRL NK cells (n=3). Bars represent mean values with standard deviation, **p ≤ 0.01.

Article Snippet: The use of a high fidelity Cas9 protein (Alt-R HiFi Cas9 v3, IDT) further reduced the risk of off-target events to <0.5% ( ).

Techniques: Mass Cytometry, Expressing, Marker, Generated, Transformation Assay, RNA Sequencing Assay, Purification, Co-Culture Assay, Fluorescence, Standard Deviation

a , Schematic diagram representing the timeline of the in vivo experiments. b , Bioluminescent imaging (BLI) was used to monitor the growth of FFluc-labeled Raji tumor cells in NSG mice. The mice were treated with Raji alone, Raji plus one dose of 10 x 10 6 of NT, NT Cas9 CTRL or NT CISH KO NK cells (5 mice per group). Colors indicate intensity of luminescence with red representing higher and blue lower intensity. c , Kaplan Meier plots showing the probability of survival for the four groups of mice described in panel b. d , BLI data from five groups of NSG mice treated with Raji alone (n=5), Raji plus one dose of 3 x 10 6 of iC9/CAR19/IL-15 CTRL NK cells (n=5) or iC9/CAR19/IL-15 CISH KO NK cells (n=5) or Raji plus one dose of 10 x 10 6 of iC9/CAR19/IL-15 CTRL NK cells (n=5) or iC9/CAR19/IL-15 CISH KO NK cells (n=3). The average radiance ( e ) and survival curves ( f ) are shown for the five groups of mice described in panel d. Statistical significance is represented by *p≤ 0.05 or **p≤ 0.01. g , Photomicrographs of H&E and immunohistochemical CD20 staining of liver (top) and bone marrow (BM) (bottom) from mice engrafted with Raji B cell lymphoma and treated with iC9/CAR19/IL-15 CISH KO or iC9/CAR19/IL-15 CTLR NK cells (10 x 10 6 dose level). Representative images show absence of neoplastic B cells in liver and bone marrow of a mouse treated with iC9/CAR19/IL-15 CISH KO NK cells in comparison to similar treatment with iC9/CAR19/IL-15 NK cells retaining CISH expression. Images were taken at 10x (liver) and 5x (bone marrow) using a Leica DFC 495 camera. h , Bar graph showing the percentage of NK cells (CD3-CD56+CD45+) present in peripheral blood from mice treated with iC9/CAR19/IL-15 CTRL vs. iC9/CAR19/IL-15 CISH KO NK cells at days 7, 14, 21 and 28. Bars represent mean values with standard deviation. Statistical significance is represented by *p≤ 0.05 or **p≤ 0.01. i , Graph showing body weights of NSG mice groups described in panel d over time.

Journal: bioRxiv

Article Title: CIS checkpoint deletion enhances the fitness of cord blood derived natural killer cells transduced with a chimeric antigen receptor

doi: 10.1101/2020.03.29.014472

Figure Lengend Snippet: a , Schematic diagram representing the timeline of the in vivo experiments. b , Bioluminescent imaging (BLI) was used to monitor the growth of FFluc-labeled Raji tumor cells in NSG mice. The mice were treated with Raji alone, Raji plus one dose of 10 x 10 6 of NT, NT Cas9 CTRL or NT CISH KO NK cells (5 mice per group). Colors indicate intensity of luminescence with red representing higher and blue lower intensity. c , Kaplan Meier plots showing the probability of survival for the four groups of mice described in panel b. d , BLI data from five groups of NSG mice treated with Raji alone (n=5), Raji plus one dose of 3 x 10 6 of iC9/CAR19/IL-15 CTRL NK cells (n=5) or iC9/CAR19/IL-15 CISH KO NK cells (n=5) or Raji plus one dose of 10 x 10 6 of iC9/CAR19/IL-15 CTRL NK cells (n=5) or iC9/CAR19/IL-15 CISH KO NK cells (n=3). The average radiance ( e ) and survival curves ( f ) are shown for the five groups of mice described in panel d. Statistical significance is represented by *p≤ 0.05 or **p≤ 0.01. g , Photomicrographs of H&E and immunohistochemical CD20 staining of liver (top) and bone marrow (BM) (bottom) from mice engrafted with Raji B cell lymphoma and treated with iC9/CAR19/IL-15 CISH KO or iC9/CAR19/IL-15 CTLR NK cells (10 x 10 6 dose level). Representative images show absence of neoplastic B cells in liver and bone marrow of a mouse treated with iC9/CAR19/IL-15 CISH KO NK cells in comparison to similar treatment with iC9/CAR19/IL-15 NK cells retaining CISH expression. Images were taken at 10x (liver) and 5x (bone marrow) using a Leica DFC 495 camera. h , Bar graph showing the percentage of NK cells (CD3-CD56+CD45+) present in peripheral blood from mice treated with iC9/CAR19/IL-15 CTRL vs. iC9/CAR19/IL-15 CISH KO NK cells at days 7, 14, 21 and 28. Bars represent mean values with standard deviation. Statistical significance is represented by *p≤ 0.05 or **p≤ 0.01. i , Graph showing body weights of NSG mice groups described in panel d over time.

Article Snippet: The use of a high fidelity Cas9 protein (Alt-R HiFi Cas9 v3, IDT) further reduced the risk of off-target events to <0.5% ( ).

Techniques: In Vivo, Imaging, Labeling, Immunohistochemical staining, Staining, Expressing, Standard Deviation

a, Sequences of off-target sites identified by GUIDE-Seq for two guides targeting the CISH locus. The guide sequence is listed on top with off-target sites shown below. The on-target site is identified with a black square. Mismatches to the guide are shown and highlighted in color with insertions shown in grey. The number of GUIDE-Seq sequencing reads are shown to the right of each site. 10 μM Alt-R crRNA XT complexed to Alt-R tracrRNA was delivered into HEK293 cells that constitutively express Cas9 nuclease by nucleofection. b, Pie charts indicate the fractional percentage of the total unique, CRISPR/Cas9 specific read counts that are on-target (orange) and off-target (blue). Total editing at the on- and off-target sites identified by GUIDE-Seq was measured using rhAmpSeq, a multiplexed targeted enrichment approach for next generation sequencing (NGS). For each of the two CISH targeting guides amplicons were designed around each Cas9 cleavage site with reads >1% of the on target GUIDE-Seq reads. RNP complexes formed with either WT Cas9 (blue) or Alt-R HiFi Cas9 (orange) were delivered via electroporation into expanded NK cells. c, INDEL formation at each targeted loci for CISH guide 1 (panel 1, 11-plex) and CISH guide 2 (panel 2, 70-plex) when a single RNP complex was delivered. The on-target locus is indicated with a black asterisk underneath the first 2 bars of each graph. d, INDEL formation at each targeted loci when CISH guide 1 and CISH guide 2 were co-delivered. The on-target locus is indicated with a black asterisk underneath the first 2 bars of each graph.

Journal: bioRxiv

Article Title: CIS checkpoint deletion enhances the fitness of cord blood derived natural killer cells transduced with a chimeric antigen receptor

doi: 10.1101/2020.03.29.014472

Figure Lengend Snippet: a, Sequences of off-target sites identified by GUIDE-Seq for two guides targeting the CISH locus. The guide sequence is listed on top with off-target sites shown below. The on-target site is identified with a black square. Mismatches to the guide are shown and highlighted in color with insertions shown in grey. The number of GUIDE-Seq sequencing reads are shown to the right of each site. 10 μM Alt-R crRNA XT complexed to Alt-R tracrRNA was delivered into HEK293 cells that constitutively express Cas9 nuclease by nucleofection. b, Pie charts indicate the fractional percentage of the total unique, CRISPR/Cas9 specific read counts that are on-target (orange) and off-target (blue). Total editing at the on- and off-target sites identified by GUIDE-Seq was measured using rhAmpSeq, a multiplexed targeted enrichment approach for next generation sequencing (NGS). For each of the two CISH targeting guides amplicons were designed around each Cas9 cleavage site with reads >1% of the on target GUIDE-Seq reads. RNP complexes formed with either WT Cas9 (blue) or Alt-R HiFi Cas9 (orange) were delivered via electroporation into expanded NK cells. c, INDEL formation at each targeted loci for CISH guide 1 (panel 1, 11-plex) and CISH guide 2 (panel 2, 70-plex) when a single RNP complex was delivered. The on-target locus is indicated with a black asterisk underneath the first 2 bars of each graph. d, INDEL formation at each targeted loci when CISH guide 1 and CISH guide 2 were co-delivered. The on-target locus is indicated with a black asterisk underneath the first 2 bars of each graph.

Article Snippet: The use of a high fidelity Cas9 protein (Alt-R HiFi Cas9 v3, IDT) further reduced the risk of off-target events to <0.5% ( ).

Techniques: Sequencing, CRISPR, Next-Generation Sequencing, Electroporation